背景をグラフ用紙っぽくする
2016/09/21
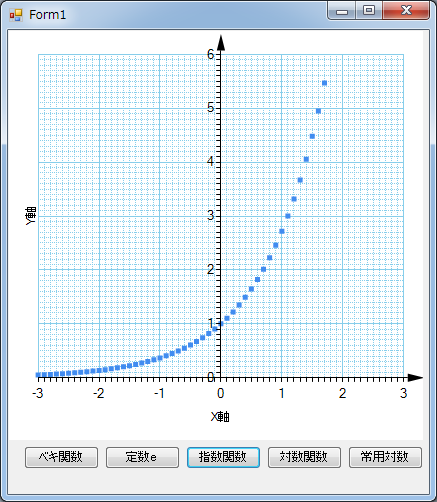
だいぶグラフ用紙っぽくなってきました。
縦横の比は適当です。
Private Sub setGrid(minX As Double, maxX As Double, minY As Double, maxY As Double)

    Chart1.ChartAreas(0).AxisX.Crossing = 0
    Chart1.ChartAreas(0).AxisX.Maximum = maxX
    Chart1.ChartAreas(0).AxisX.Minimum = minX
    Chart1.ChartAreas(0).AxisY.Crossing = 0
    Chart1.ChartAreas(0).AxisY.Maximum = maxY
    Chart1.ChartAreas(0).AxisY.Minimum = minY

    ' Set Arrow Style
    Chart1.ChartAreas("ChartArea1").AxisY.ArrowStyle = AxisArrowStyle.SharpTriangle
    Chart1.ChartAreas("ChartArea1").AxisX.ArrowStyle = AxisArrowStyle.SharpTriangle
    Chart1.ChartAreas("ChartArea1").AxisY.Title = "Y軸"
    Chart1.ChartAreas("ChartArea1").AxisX.Title = "X軸"
    ' Enable all elements
    Chart1.ChartAreas("ChartArea1").AxisX.MinorGrid.Enabled = True
    Chart1.ChartAreas("ChartArea1").AxisX.MinorTickMark.Enabled = True
    Chart1.ChartAreas("ChartArea1").AxisY.MinorGrid.Enabled = True
    Chart1.ChartAreas("ChartArea1").AxisY.MinorTickMark.Enabled = True

    ' Set Grid lines and tick marks interval
    Chart1.ChartAreas("ChartArea1").AxisX.MajorGrid.Interval = 1
    Chart1.ChartAreas("ChartArea1").AxisX.MajorTickMark.Interval = 1
    Chart1.ChartAreas("ChartArea1").AxisX.MinorGrid.Interval = 0.1
    Chart1.ChartAreas("ChartArea1").AxisX.MinorTickMark.Interval = 0.1
    Chart1.ChartAreas("ChartArea1").AxisY.MajorGrid.Interval = 1
    Chart1.ChartAreas("ChartArea1").AxisY.MajorTickMark.Interval = 1
    Chart1.ChartAreas("ChartArea1").AxisY.MinorGrid.Interval = 0.1
    Chart1.ChartAreas("ChartArea1").AxisY.MinorTickMark.Interval = 0.1

    Chart1.ChartAreas("ChartArea1").AxisX.Interval = 1
    Chart1.ChartAreas("ChartArea1").AxisY.Interval = 1

    ' Set Line Color
    Chart1.ChartAreas("ChartArea1").AxisX.MinorGrid.LineColor = Color.SkyBlue
    Chart1.ChartAreas("ChartArea1").AxisX.MajorGrid.LineColor = Color.SkyBlue

    Chart1.ChartAreas("ChartArea1").AxisY.MinorGrid.LineColor = Color.SkyBlue
    Chart1.ChartAreas("ChartArea1").AxisY.MajorGrid.LineColor = Color.SkyBlue

    ' Set Line Style
    Chart1.ChartAreas("ChartArea1").AxisX.MajorTickMark.LineDashStyle = ChartDashStyle.Solid
    Chart1.ChartAreas("ChartArea1").AxisX.MinorGrid.LineDashStyle = ChartDashStyle.Dot

    Chart1.ChartAreas("ChartArea1").AxisY.MajorTickMark.LineDashStyle = ChartDashStyle.Solid
    Chart1.ChartAreas("ChartArea1").AxisY.MinorGrid.LineDashStyle = ChartDashStyle.Dot

    ' Set Line Width
    Chart1.ChartAreas("ChartArea1").AxisX.MajorGrid.LineWidth = 1
    Chart1.ChartAreas("ChartArea1").AxisY.MajorGrid.LineWidth = 1

End Sub